Read my latest on 5 lessons from political science to help rebuild Syria in The Conversation.
A More Realistic P-Value for the Pfizer Vaccine Report
Modeling the Vaccine Study Using the Beta-Binomial Distribution
The clinical pre-registration for the Moderna vaccine defines clearly what statistic we should use to evaluate their trial, in contrast to their press release.
I start with Eric Novik’s excellent blog post on how to calculate the relevant statistics for the vaccine, i.e. vaccine efficacy (VE). This is defined as:
Where is the proportion of cases in the treatment (vaccinated) group with COVID-19 and is the proportion of cases in the control (un-vaccinated) group). This is kind of an odd statistic as it would seem to make more sense to simply report the ratio rather than one minus the ratio, although subtracting one means a null ratio (difference of 1) equals zero. I am not sure a general audience is very aware of the distinction and what VE in fact means. In essence, if we assume the vaccinated group will have no more cases than the control group, this statistic will converge to 1 as goes to zero, so VE of 100% would be a case in which there are no cases in the treatment group.
As Eric Novik shows, the VE is actually a calculated quantity and isn’t modeled directly. The clinical pre-registration says they will use a beta-binomial model. The put a prior on a transformation of the VE (vaccine efficacy) of . We can get an idea of what that looks like by examining the distribution of these values:
This prior puts significant mass at negative VEs which would suggest that the vaccine actually makes things worse for the treatment group than for the control group. While this would seem unrealistic, it also suggests that very high VEs, such as above 90%, are relatively unlikely. We can see that the prior suggests it is about as likely that the VE is negative (the vaccine causes the virus) as it is likely that the VE is greater than 80%.
Given this conservative but weakly informative prior, we can then calculate a p-value for what they pre-register in their study, which is the probability that the VE (vaccine efficacy) is greater than 30%. We can then fit a Bayesian beta-binomial model with these priors by modifying Eric Novik’s original code:
# from Eric Novik, changed the prior per pre-regvac_model <-"data { int<lower=1> r_c; // num events, control int<lower=1> r_t; // num events, treatment int<lower=1> n_c; // num cases, control int<lower=1> n_t; // num cases, treatment array[2] real a; // prior values for treatment effect}parameters { real<lower=0, upper=1> p_c; // binomial p for control real<lower=0, upper=1> p_t; // binomial p for treatment }transformed parameters { real VE = 1 - p_t / p_c; // vaccine effectiveness}model { (VE - 1)/(VE - 2) ~ beta(a[1], a[2]); // prior for treatment effect r_c ~ binomial(n_c, p_c); // likelihood for control r_t ~ binomial(n_t, p_t); // likelihood for treatment}generated quantities { real effect = p_t - p_c; // treatment effect real log_odds = log(p_t / (1 - p_t)) - log(p_c / (1 - p_c));}"to_stan <-cmdstan_model(write_stan_file(vac_model))n <-4.4e4# number of volunteersr_c <-162# number of events in controlr_t <-8# number of events in vaccine groupstan_data <-list(n=n,r_c=r_c,r_t=r_t,n_c=n/2,n_t=n/2,a=c(.700102,1))
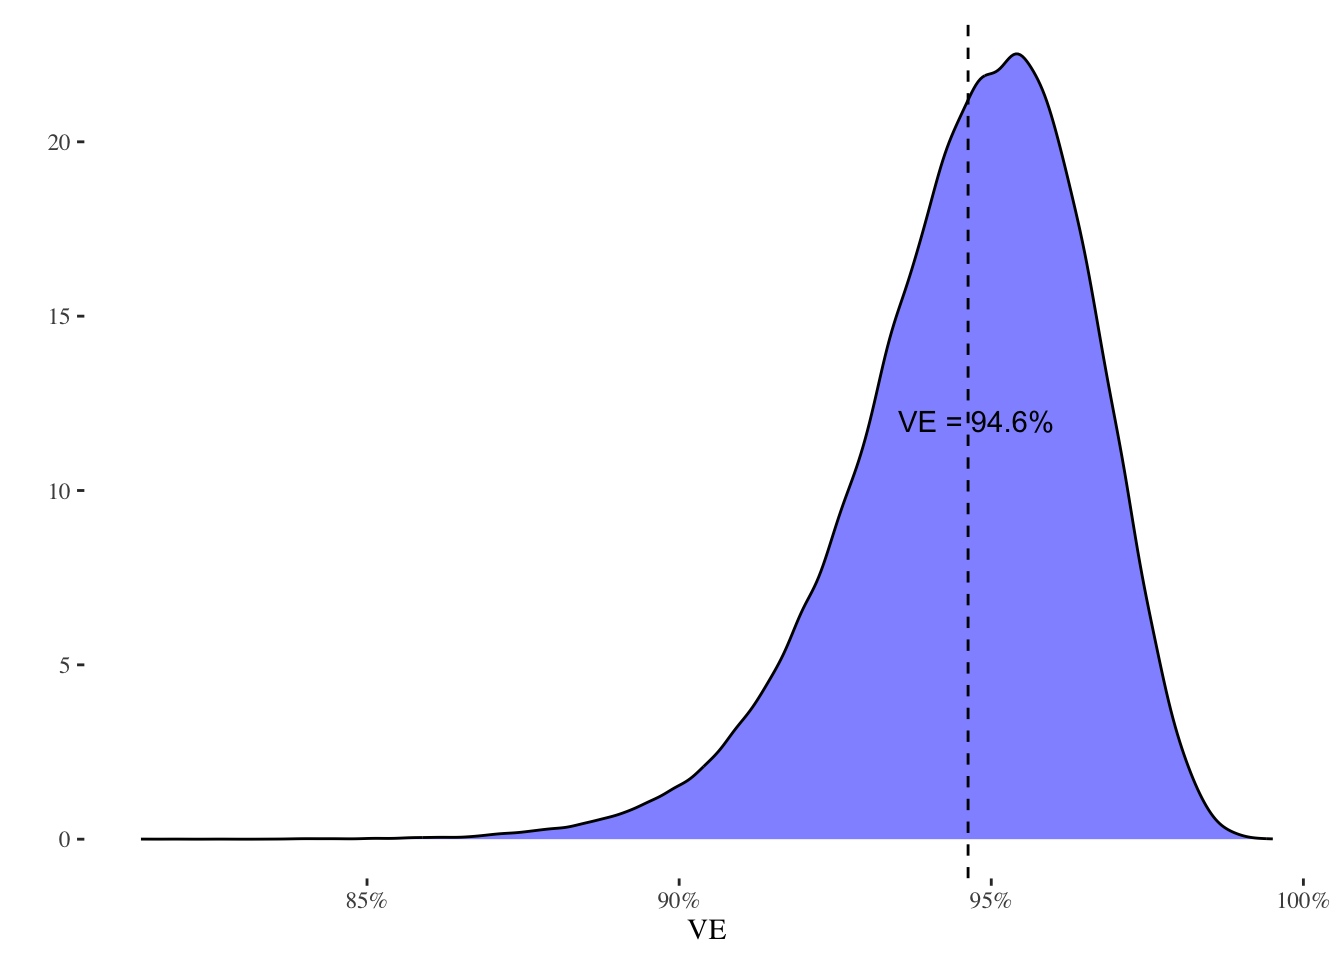
Then we can sample and plot the results. We’ll draw a lot of samples so we can get good estimates in the tails (i.e. very low p-values).
This estimate matches the press release. So let’s calculate the p-value:
mean(1-as.numeric(draws$VE>.3))
[1] 0
Virtually nil.
However, we can also test some other thresholds, such as the FDA value of 50% VE:
mean(1-as.numeric(draws$VE>.5))
[1] 0
Still vanishingly small. We can try something a bit closer, such as whether VE exceeds 90%:
mean(1-as.numeric(draws$VE>.9))
[1] 0.01883
This p-value is at least reportable at 0.02. As this is a Bayesian model, this can be interpreted directly that the probability that the vaccine efficacy is less than 90% is quite small, less than a 2% chance.